

Reading a project
A project consists of several trees that you can go to visit. The first is the one with the best explanatory / predictive index of the indicator you are trying to explain.
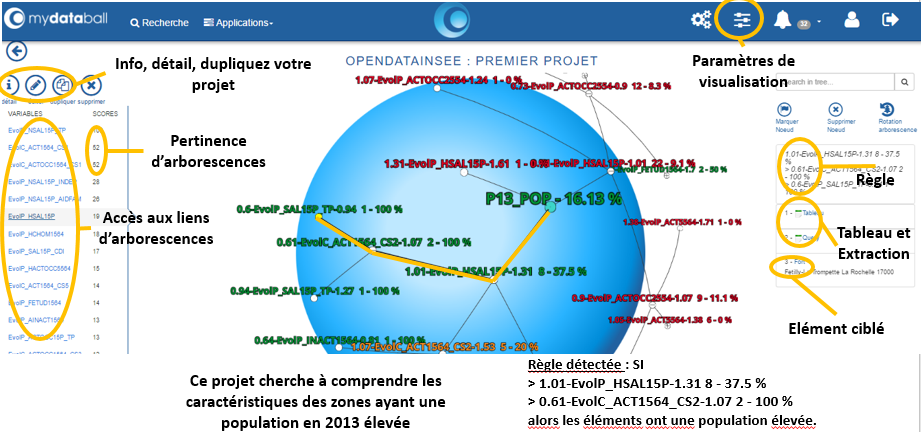
On the left, you have the list of trees. They are named after the name of the first variable that appears on the tree. A score between 0 and 100 is assigned to each tree. It gives its level of relevance. The higher it is, the more the tree explains and predicts the indicator being studied. By clicking on the tree link, you will see this tree in the center.
In the center, you view the selected tree. If the central node is red, you are looking for the low values of your indicator; if the central node is green, you are looking for the high values of your indicator. In the tree, if the node is green, the proportion of items with a high value indicator is strong; if he is red, the proportion of items with a low value indicator is strong; if he is orange, the proportion of items with a mixed value indicator is strong.
By clicking and moving the sphere with your mouse, you can clarify your point of view and go into the depths of the tree. In addition, you can deploy more nodes or retract the nodes depending on the viewing parameters. You can also mark a node.
You will be able to note that while sailing in the various trees, the lower the score, the more the colors of the knots are mixed. Conversely, the higher the score, the more green, red and orange are spérarés.
On the right, you will find the detail of a node by clicking on it: you access the selection of the attributes of the rule. The more you select a node far from the root of the tree, the deeper the rule will be (depth is the number of dimensions involved in a rule).
By selecting a node, you can extract the population by clicking on "Query" and access the "Dashboard" in Excel format that serves as reporting (detection of relevant dashboards). The elements of the nodes are also listed. Clicking on it will take you to the geo-position of the element.
MyDataBall is compatible with BI market tools (Qlik, Tableau, SpoteFire, PowerBI, ...). We can imagine links and open other features with other tools on the market.